Explore Mode
Explore Mode is your semantic code browser. Navigate files, view syntax-highlighted source, and ask Iris "why does this code exist?" to get AI-powered historical analysis.
When to Use Explore Mode
- Understanding unfamiliar code: Jump into a new codebase and get oriented
- Investigating bugs: Find out why a suspicious line was added
- Code archaeology: Trace the evolution of a feature through commits
- Learning patterns: See how the codebase implements specific patterns
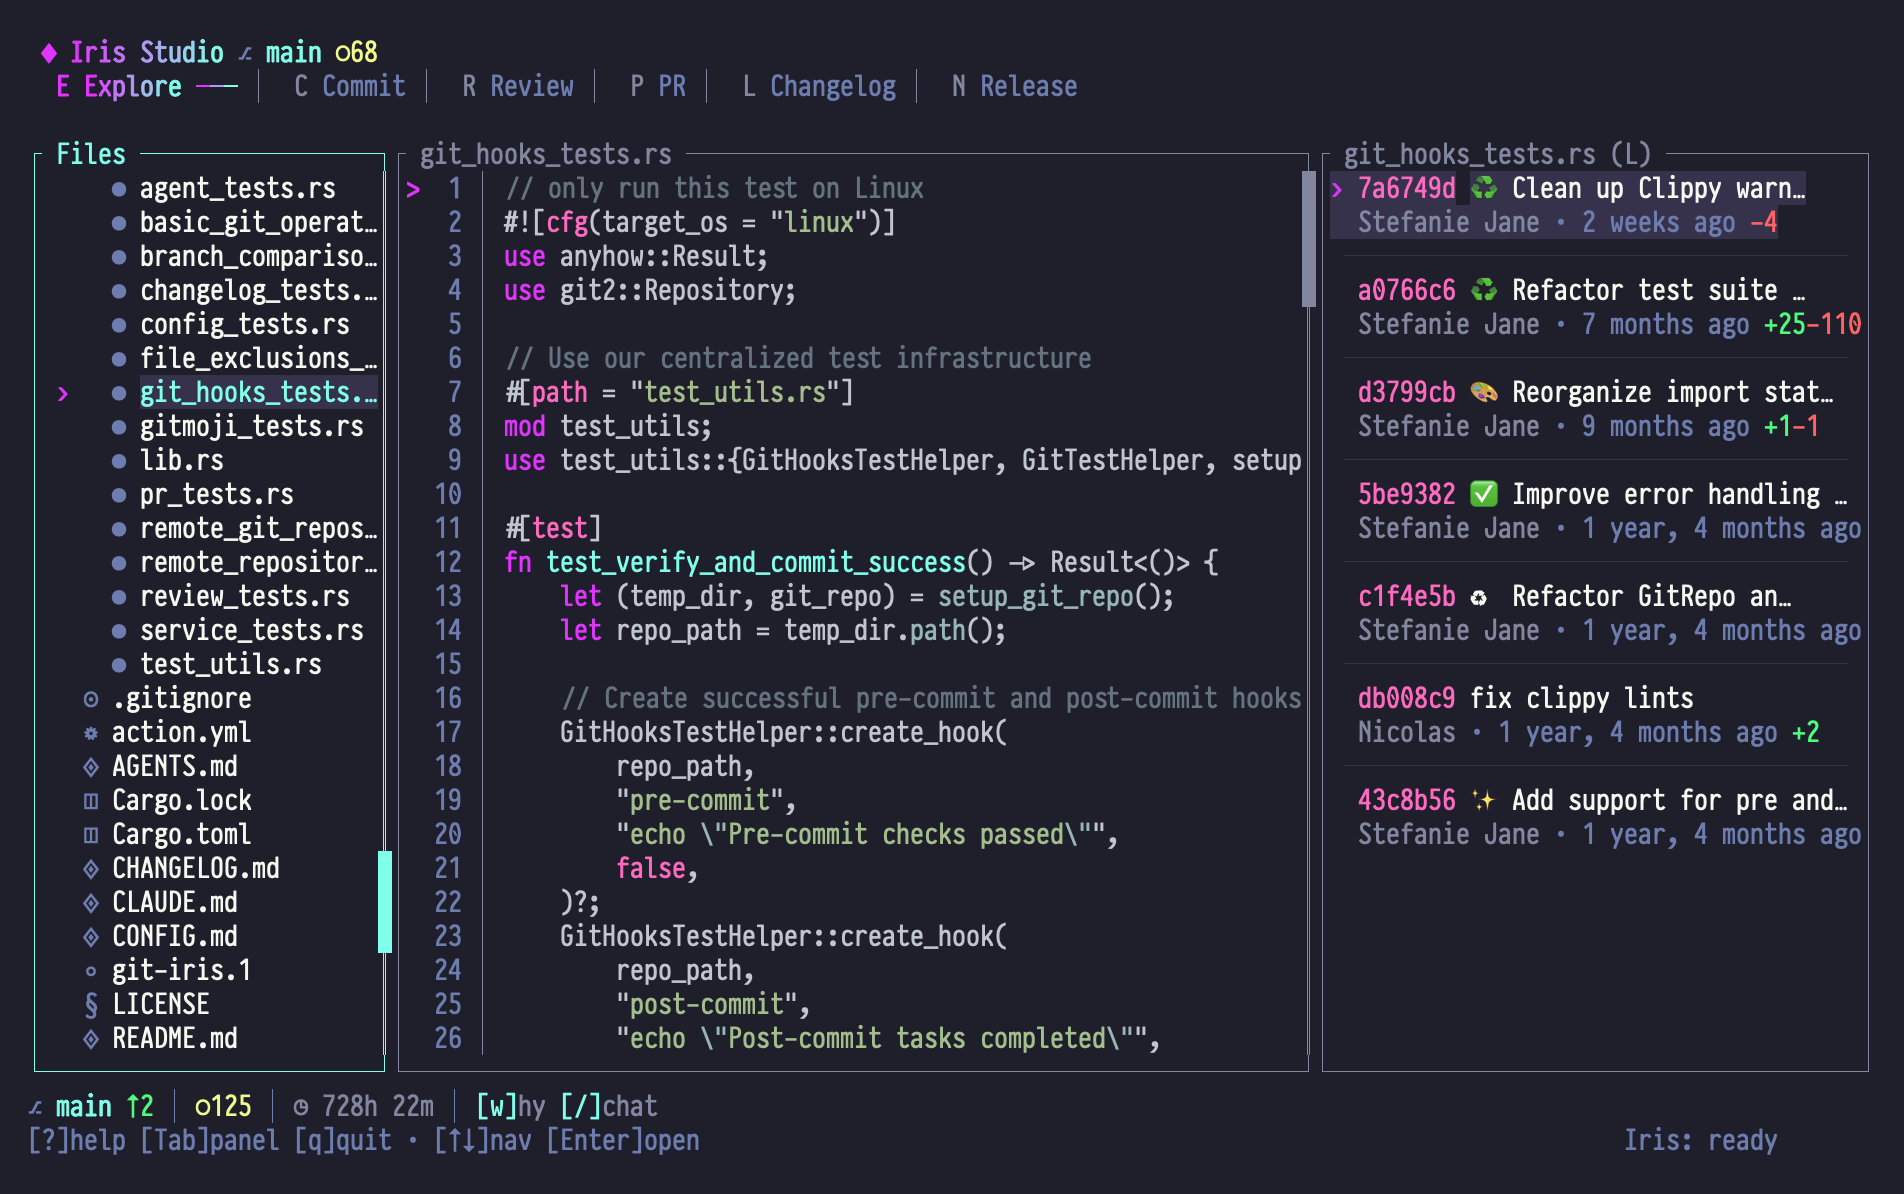
Panel Layout
| Panel | Content |
|---|---|
| Left | File tree with git status indicators |
| Center | Syntax-highlighted code with line numbers |
| Right | Commit log for the current file (toggle to global log with L), or semantic blame after you press w |
| Bottom Bar | Companion status: branch, ahead/behind, staged/unstaged, session timer |
Left Panel: File Tree
- Shows repository directory structure
- Syntax-highlighted by file type
- Git status indicators (modified, staged, etc.)
- Collapsible directories
Center Panel: Code View
- Syntax-highlighted source code
- Line numbers
- Current line indicator
- Visual selection support
Right Panel: File Log / Blame Analysis
The right panel has three states:
- File log (default) — git history for the file open in the code view. Each entry shows the commit hash, message, author, relative time, and
+/-line stats. - Global commit log — branch-wide commit log when there is no file selected, or when you press L to toggle to the global view. Press L again to return to per-file history.
- Semantic blame — replaces the log after you press w on a line (or selection) in the code view. Iris explains why the code exists, referencing the related commits.
Bottom Bar: Companion Status
Explore mode renders a slim status line at the bottom of the screen, powered by the companion subsystem (src/companion/). It surfaces:
⎇ branch— current branch in Neon Cyan, bold↑N ↓M— commits ahead/behind upstream●N ○M— staged / unstaged file counts (orclean)◷ duration— current Iris session length- A welcome message after branch switches (italicized in Electric Purple)
[w] why [/] chat— quick hint reminders
Essential Keybindings
File Tree (Left Panel)
| Key | Action |
|---|---|
| j / ↓ | Select next file |
| k / ↑ | Select previous file |
| h / ← | Collapse directory |
| l / → | Expand directory |
| Enter | Expand directory or load file (moves focus to code view) |
| g / Home | Jump to first file |
| G / End | Jump to last file |
| Ctrl+d / PgDn | Page down |
| Ctrl+u / PgUp | Page up |
Code View (Center Panel)
| Key | Action |
|---|---|
| j / ↓ | Move down one line |
| k / ↑ | Move up one line |
| g / Home | Jump to first line |
| G / End | Jump to last line |
| Ctrl+d / PgDn | Page down |
| Ctrl+u / PgUp | Page up |
| v | Enter/exit visual selection mode |
| w | Ask "why does this code exist?" (semantic blame) |
| y | Copy current line (or selection if in visual mode) |
| Shift+Y | Copy entire file content |
| Shift+L / L | Shift+L is the global mode switcher (Changelog); within Explore, L toggles the right panel between per-file history and the global commit log |
| o | Open in $EDITOR (shows command, doesn't suspend TUI) |
Context Panel (Right Panel)
| Key | Action |
|---|---|
| j / ↓ | Select next commit in the log |
| k / ↑ | Select previous commit in the log |
| g / Home | Jump to most recent commit |
| G / End | Jump to oldest commit |
| Ctrl+d / PgDn | Page down by ten commits |
| Ctrl+u / PgUp | Page up by ten commits |
| L | Toggle between per-file history and the global commit log |
| Enter | Copy a ready-to-run git show <hash> command to the clipboard (scoped to the file when in per-file mode) |
| y | Copy just the selected commit's short hash to the clipboard |
Visual Selection Mode
Press v to enter vim-style visual selection:
 42  pub fn new() {
 43    Self {                    ← Press 'v' here (anchor point)
 44      mode: EmojiMode::Auto,
 45      editing: false,
 46    }                          ← Press 'j' to extend selection
 47  }
Visual Mode Controls
| Key | Action |
|---|---|
| v | Toggle visual mode on/off |
| j / k | Extend selection up/down |
| y | Copy selected lines to clipboard |
| Esc | Clear selection and exit visual mode |
What You Can Do with Selection
- Copy code snippets: Select + y → paste anywhere
- Ask about multiple lines: Select + w → Iris explains the entire block
- Visual feedback: Selected lines highlighted in Electric Purple
Semantic Blame: The "Why?" Feature
Press w on any line to ask "why does this code exist?"
What Happens
- Iris gathers git blame data for that line
- Analyzes related commits
- Reads commit messages and diffs
- Generates a semantic explanation
Example
You press w on line 43:
 42  pub fn new() {
 43    Self {
 44      mode: EmojiMode::Auto,  ← Cursor here, press 'w'
Iris responds in the right panel:
Why does this code exist?

This initialization was added to support automatic emoji
selection in commit messages. Previously, emoji mode was a
simple boolean flag (use_gitmoji).

The change to an enum (EmojiMode::Auto) allows three states:
- None (no emoji)
- Auto (AI chooses)
- Custom (user picks)

This enables smarter defaults while preserving user control.

Related Commits:
• abc123f (2024-01-15) "Add emoji mode enum"
  Introduced EmojiMode to replace boolean flag

• def456a (2024-01-14) "Add emoji selector modal"
  Created UI for manual emoji selection
With Visual Selection
Select multiple lines, then press w:
 43    Self {
 44      mode: EmojiMode::Auto,
 45      editing: false,
 46      messages: vec![],  ← Selection from 43-46, press 'w'
 47    }
Iris explains the entire block and how it evolved together.
Clipboard Integration
Copy Current Line
Position cursor, press y:
✓ Line copied to clipboardCopy Selection
Enter visual mode (v), select lines, press y:
✓ 5 lines copied to clipboardCopy Entire File
Press Shift+Y anywhere:
✓ File content copied to clipboardSyntax Highlighting
Code is syntax-highlighted based on file extension:
- Rust (
.rs): Keywords in Electric Purple, types in Neon Cyan - JavaScript/TypeScript (
.js,.ts,.tsx): Standard syntax colors - Markdown (
.md): Headers, links, code blocks - TOML/YAML (
.toml,.yml): Config-specific highlighting - Plain text: Monochrome
Colors follow the SilkCircuit Neon palette.
Workflow Examples
Example 1: Understanding a New Codebase
Goal: Learn how the state management works
- Open Studio in Explore mode
- Navigate to
src/studio/state/mod.rsin file tree - Press Enter to load file
- Scan through code with j/k
- See
StudioStatestruct at line 789 - Press w to ask why it exists
- Read Iris's explanation in right panel
- Press / to open chat: "Show me how state flows through the reducer"
Example 2: Investigating a Bug
Goal: Find out why file selection is broken
- Navigate to
src/studio/handlers/commit.rs - Find suspicious function
sync_file_selectionat line 35 - Press v to start visual selection
- Press j × 4 to select the function body
- Press w to ask why this code exists
- Iris explains: "Added to fix race condition between tree and diff views"
- Press / to chat: "Is there a better way to sync these components?"
Example 3: Learning Code Patterns
Goal: See how the codebase uses Result types
- Navigate to
src/agents/iris.rs - Press Tab to focus the right panel and scan the commit log for recent activity
- Press Tab back to the code view and jump to an error-handling block
- Press w on the code
- Iris explains: "Added to gracefully handle JSON parse errors from LLM"
- Copy pattern with y for reuse
Example 4: Code Review Prep
Goal: Understand changes before creating a PR
- In Explore mode, navigate through changed files
- For each file, press w on key changes
- Build mental model of "why" changes were made
- Switch to Review mode (Shift+R)
- Generate review with full context
- Switch to PR mode (Shift+P)
- Generate PR description (Iris remembers your exploration)
Special Features
File Status Indicators
In the file tree, files show git status:
- Green
M— Modified - Purple
A— Staged (added) - Yellow
?— Untracked - Cyan
R— Renamed - Red
D— Deleted
Smart Navigation
- Press Enter on a directory → Expands it
- Press Enter on a file → Loads it and moves focus to code view
- No need to Tab manually
Context Persistence
When you switch modes, Explore remembers:
- Current file
- Cursor position
- Expanded directories
- Visual selection state (if any)
Return to Explore mode → pick up where you left off.
Tips & Tricks
1. Use Visual Selection for Context
Don't just ask "why" about a single line. Select the entire function/struct/block for richer explanations.
2. Commit Log + Blame Combo
- Press Tab to focus the right panel
- Browse the file's commit log; press L to switch to the global log when you need branch-wide context
- Press Enter on an interesting commit to copy a
git showcommand, or y to grab just the hash - Press Tab back, position the cursor on a relevant line, and press w for semantic blame
3. Copy Before Switching Modes
If you find useful code in Explore:
- Select it (v + j/k)
- Copy it (y)
- Switch to Commit mode (Shift+C)
- Paste into commit message if relevant
4. Chat for Deeper Dives
Semantic blame gives you "why this line." Chat gives you "how does this relate to everything else?"
- Press w for quick blame
- Press / for deep architectural questions
5. File Tree Filtering (Coming Soon)
Soon you'll be able to type in the file tree to filter:
- Type
iris→ Shows only files matching "iris" - Clear filter → Back to full tree
Limitations
What Explore Can't Do
- Edit files: Read-only (use
$EDITORoutside Studio) - Show uncommitted changes: Displays HEAD version (use Commit mode for diffs)
- Navigate by symbol: No function/class jump (yet)
- Visualize change frequency: There is an internal
Shift+Htoggle for a heat map, but the corresponding renderer has not been implemented yet — pressing it currently flips a flag with no visible effect
Performance Notes
- Large files (>10,000 lines): May scroll slower
- Binary files: Not displayed (shows placeholder)
- Very deep trees: Consider using
fdor ripgrep outside TUI
Troubleshooting
"No file selected" when pressing w
You're in the file tree panel. Press Tab to move to code view, then try again.
Semantic blame takes too long
For large files or deep history:
- Select fewer lines (narrow scope)
- Use chat instead: "Why was X added?" (faster, cached)
Syntax highlighting looks wrong
Check file extension. Studio infers language from extension. Rename file or submit an issue if highlighting is broken.
Next Steps
- Learn Visual Selection techniques
- Master Chat for code questions
- Switch to Commit Mode to act on what you learned
- See Review Mode for quality analysis